
Benchmarking rehab for better care, more reimbursement
Benchmarking is a management tool used in many industries to answer the never-ending question: “How does my operation compare against those of my peer group?” In simple terms, benchmarking is defined as the sharing of performance data among a group of non-competing businesses in the same industry. The group uses the data to identify which participant has the best performance and then this becomes the benchmark against which everyone is measured in the future. The group then studies the benchmark participant’s processes to identify those methods that are producing this above-average performance with the goal of quickly migrating these practices to each member of the group. The result should be that each participant will be performing similar to or better than the “benchmark participant.”
On the surface it sounds simple—but there are some important hurdles that need to be jumped before the benefits of benchmarking begin to pay off. These include:
Getting enough benchmarking participants to ensure that a sufficiently wide variety of business practices will be compared. You don’t want either a very small group or a homogeneous group that all run their operations the same way.
Selecting and tracking the right measurement criteria so that both the symptoms and the root cause of the good performance can be clearly identified.
Ensuring that all participants will have easy access to each other’s business practices once the benchmark member(s) have been identified. Many benchmarking efforts have failed because the “good performers” suddenly became uncooperative when they discover they are “better” than the rest of the participants.
In 2004, I first started applying benchmarking techniques to the therapy departments of skilled nursing facilities (SNFs) as a consultant to a small Midwestern contract therapy provider. I quickly determined that the therapy profession and nursing homes, in general, had not yet begun using proven techniques I had learned 20 years earlier as a manager at General Electric. After a few months as a consultant, I joined the firm as chief operating officer and began implementing a rudimentary benchmarking effort that consisted of a monthly collection and analysis of 10 key operational data elements from 12 different teams of therapists. Since I was new to the industry and was not a clinician (I actually am an ex-rocket scientist, with a degree in mechanical and aerospace engineering), I was conservative and erred on the side of too much data, just to be sure we were capturing the real drivers of therapy performance.
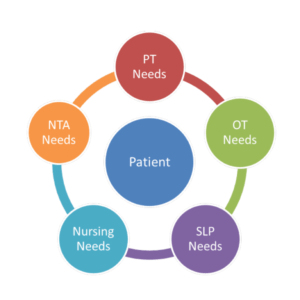
Because higher Medicare Part A (Med-A) RUG levels correlate to both better quality of care for residents and higher reimbursement for our clients’ facilities, we decided to benchmark this metric first. Our hope was to identify those therapy teams with the best RUG levels, study their practices, document their unique procedures, and then cross train the other departments with these procedures, with a win-win outcome for both patients and facilities.
Getting Started
Our first step was to isolate and remove the RUG scores of short-term rehab patients (primarily those who had just undergone joint replacements) because their therapy goals were very straightforward—it is common knowledge that these folks are at Ultra High treatment levels from the day of admission until the day they leave. By filtering out these high-end rehab patients, we were then able to concentrate our efforts on the larger and more challenging population, namely those long-term care residents who find themselves in therapy with Medicare Part A benefits after an unplanned visit to the hospital.
After six months of collecting, filtering, and comparing data on this larger group of patients, we confirmed our suspicion that it is a very homogeneous group with an almost predictable distribution of common ailments. We also discovered that across 12 SNFs in four different states, the percentage of the long-term care population with Medicare Part A benefits did not vary from building to building by more than a few percentage points, regardless of the time of year.
We found, however, that one of our therapy teams had consistently higher RUG scores than the other 11 for this very similar patient population. Not only was this one team consistently producing RUG scores that were 35% Ultra High (versus a 10% average for all others), they also had a consistent 10% longer length of stay (LOS) on therapy caseload. As we drilled down deeper and compared clinical data from this benchmark team against the other teams, we saw similar approaches with physical and occupational therapy, but very different approaches with speech therapy.
It quickly became apparent that the two speech-language pathologists (SLPs) on this team had created a set of protocols that dramatically improved the health of the patients while also improving the RUG scores for the SNF. They had observed repeatedly that a brief hospital visit by an elderly person often has a traumatic effect, with the symptoms being oral motor deficits and/or an increase in cognitive communication problems. They developed a set of screening techniques to establish precise baselines for these conditions for all residents, as well as expanded goals and more precise ways to measure progress against these goals.
By knowing more accurately where the patient was at in terms of cognition and oral motor skills before going to the hospital, they were much better prepared to conduct the evaluation and set appropriate goals when the resident returned to the facility. We also determined that by treating cognition simultaneously with rebuilding strength and ADLs, the patient was more receptive to all forms of therapy, with a higher percentage of patients reaching prior level of function before discharge. We concluded that this higher success rate was responsible for the team achieving this slightly longer LOS on therapy caseload.
We then proceeded to institutionalize this knowledge by capturing these best practices in PowerPoint training presentations that could be quickly shared with both the nursing staffs and our therapy teams in the other SNFs where there was a full-time or part-time SLP. The training for our rehab directors, which was part of a three-day off-site session in June 2005, included the enhanced speech therapy procedures described above, as well as the creation and communication of clinical standards to guide the integration of Speech with Occupational Therapy (OT) and Physical Therapy (PT).
The training for the nursing staff at each SNF was first delivered in July and August 2005 but has really never stopped. This combined training of therapists and nursing staff produced a dramatic increase in RUG levels beginning in September 2005 (see table), even though a third of these therapy teams did not yet have a full-time SLP on staff. For those therapy teams that did not yet have an SLP, we began the long and difficult task of recruiting them in the summer of 2005—a task that was more time-consuming than we had expected. For some of our SNFs, this recruiting effort lasted 18 months and required that we first increase the number of schools with which we were certified as a clinical instruction site. With these difficult staffing sites, the only way we could hire an additional SLP was to first bring them in as a student, assign one of our experienced SLPs as his or her coach, bring them on as new graduates during their Clinical Fellowship Year, and then provide supervision through attainment of their certificate of clinical competency. As we brought on additional rookie SLPs and trained them over the next 24 months, the average percentage of Ultra High Med-A days continued to slowly climb in this benchmark group.
Where We Are Today
From June 2005 to June 2007, we tripled the speech-language therapist population in these 12 buildings, while also increasing the PT and OT population by 50%. Our company is now affiliated with 25 schools, and more than 20 students do a clinical assignment with us each year. Our clinical benchmarking database now covers data collected from 150,000 therapy sessions and goes back over 30 months. Each month, we share a summary of these results with our clients. In addition, our executive team reviews the latest benchmarking results, looking for indications of other best practices, as well as signs that retraining on existing practices may be needed. We are now confident that if we know the makeup of the SNF population and we have the therapy staff properly trained in these new methods, we can accurately anticipate appropriate therapy staff levels, RUG scores, and length of stay.
Overall, these benchmarking, recruiting, and training efforts have yielded some impressive results for our SNF clients and their patients, including:
A 200% increase in the percentage of Med-A days that are Ultra High for the long-term care population in the nursing homes we serve. We now regularly deliver RUG levels of 30% to 35% Ultra with a patient population comprised entirely of long-term care nursing home residents, as opposed to the 12% level we delivered in the first three months of these measurements. This improved RUG distribution translates to Med-A reimbursement of more than $420 per Med-A day for most clients.
A 20% increase in average LOS before discharge from therapy.
A 25% increase in the number of patients directly discharged from therapy case-load to either home or an assisted living environment. We attribute this metric to a combination of improved patient care and an improving reputation for the facilities we serve—that is, this improved reputation has resulted in a slowly but steadily growing population of short-term rehab patients that previously were not sent to these facilities.
From our clients’ point of view, benchmarking with proper follow-up and training obviously works! The table shows how the percent of Ultra High days has increased over time at the 12 SNFs we have benchmarked since October of 2004. Although we provide therapy services to more than 12 buildings today, this original group continues to be our baseline for year-to-year progress for our clinical programs.
For more information, call (877) 562-3336 or visit https://www.simplyrehab.com. To send your comments to the author and editors, e-mail kunio1107@nursinghomesmagazine.com.
Related Articles


Topics: Articles , Medicare/Medicaid , Rehabilitation